
Anomaly Detection: Non-Programming Way
BUSINESS INTELLIGENCE
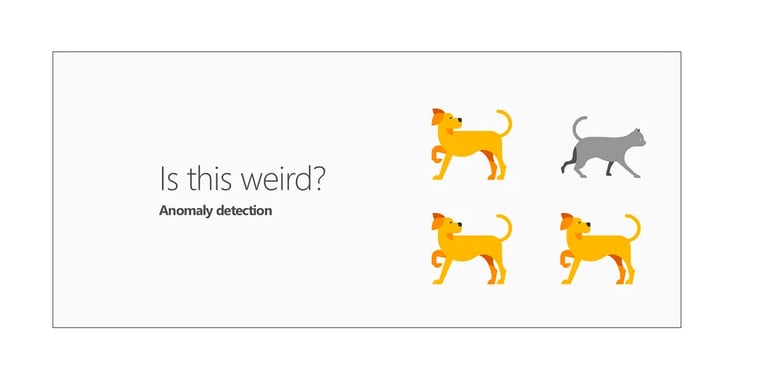
I was once asked, how to determine anomaly/outlier in data set without using any analytical tool or programming language? One more condition added, there is no historical data and no upper/lower threshold given. The one thing that came to my mind is the Excel Quartile function.
An anomaly/outlier is any data point that does not fall within the common range of the majority of the data points in a data set. Anomaly/outliers are either way too high or way too low to be truly representative data.
Quartile
A quartile is a statistical division of a data set into four equal groups, with each group making up 25 percent of the data. The top 25 percent of a collection is considered to be the 1st quartile, whereas the bottom 25 percent is considered the 4th quartile. This concept of estimating the quartile demarcation value is called interpolation.
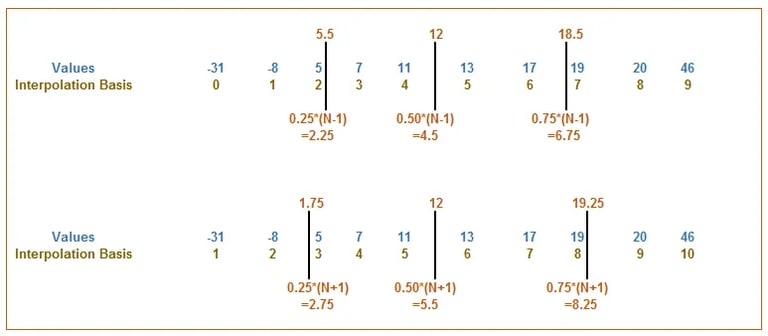
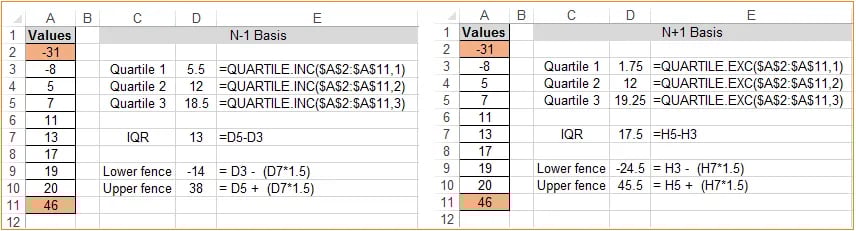
Let’s take a look at how this works. We would take 10 values(sorted ascending order) and place them side by side. Then underneath, we add a kind of index that gives each value a position. This index can be considered to be an interpolation basis. There are two types of interpolation N-1 basis and N+1 basis. N stands for the count of values and -1 indicates where we start indexing. In Excel, the QUARTILE and QUARTILE.INC function calculates on an N-1 basis, whereas QUARTILE.EXC calculates on an N+1 basis.
N-1 Basis
To find out where we draw the line for the quartiles , we calculate
Q1 = 0.25*(N-1) = 0.25*(10–1) = 2.25
Q2 = 0.50*(N-1) = 0.50*(10–1) = 4.5
Q3 = 0.75*(N-1) = 0.75*(10–1) = 6.75
N +1 Basis
To find out where we draw the line for the quartiles , we calculate
Q1 = 0.25*(N+1) = 0.25*(10+1) = 2.75
Q2 = 0.50*(N+1) = 0.50*(10+1) = 5.5
Q3 = 0.75*(N+1) = 0.75*(10+1) = 8.25
Taking these two quartiles, we can calculate the statistical 50 percent of the data set by subtracting the 3rd quartile from the 1st quartile. This statistical 50 percent is called the inter-quartile range (IQR). Statisticians generally agree that IQR*1.5 can be used to establish a reasonable upper and lower fence. Any value greater than the upper fence or less than the lower fence is considered an outlier.
The lower fence is equal to the 1st quartile — IQR*1.5.
The upper fence is equal to the 3rd quartile + IQR*1.5.
A couple of things to note:
1. The 2nd quartile will always be the same between any quartile methods you use. The 2nd quartile is effectively the Median so that is locked.
2. QUARTILE.EXC excludes the median (middle number) from the population. This function results in quartiles that are further from the center of the whole. This gives us a better estimate of the actual population and gives us a potentially more accurate view of what values should be considered outliers.
3. Both the QUARTILE and QUARTILE.INC includes the median (middle number) when determining interpolation. These functions are handy if you require relatively symmetrical quartiles. However, these functions shrink your inter-quartile range (distance between the upper and lower quartiles), making it more difficult to identify true statistical outliers
Now we would use Excel conditional formatting to highlight the outlier/anomaly in the data set.
Select the data cells in your target range (cells A2:A11 in this example), click the Home tab of the Excel Ribbon, and then select Conditional Formatting→New Rule
Click the ‘Use a Formula to Determine which Cells to Format’ option
In the formula input box, enter the formula =OR(A2<$D$9, A2>$D$10)
Click the Format button. Click the Fill tab.
Select the color of your choice, and click OK.
Back in the New Formatting Rule dialogue box, click the OK button to confirm your formatting rule.
I will be happy to help if you have any questions. Also, I would love to hear from you, if you could share any non-programming way to determine Anomaly/Outliers in the data set.

15+ years of IT work experience as Technical delivery Lead, Analytics Architect, AEP/CJA Implementation Consultant.
Adobe certified expert in Adobe Analytics, Adobe Target, Adobe Experience Platform (AEP), Real-Time Customer Data Platform (RT-CDP), Customer Journey Analytics (CJA), Journey Optimizer (AJO). Well versed with Google Analytics Server-side, Conversion API (CAPI), Privacy & Consent Management (OneTrust).
Deputed to Canada, USA, Netherlands, Germany, UK to work closely with business clients, business analysts, solution architects, solution designers, and other key stakeholders. Passionate to decode the online consumer behaviour by using an analytics data-driven approach.


From Strategy to Execution,
Your Consulting Partner
Connect: connect@ShiftLytic.ca
Shiftlytic © 2026. All rights reserved.
location: USA, CANADA, INDIA
consulting SERVICES
mARTECH